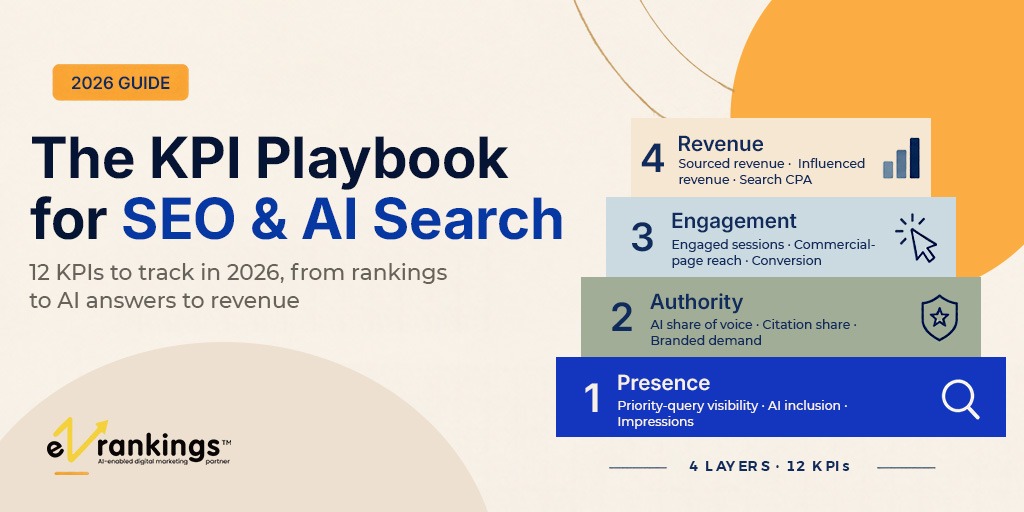
The KPI Playbook for SEO & AI Search: 12 KPIs to Track in 2026
SEO KPIs for AI search are the metrics that show whether your brand appears in Google results and AI answers, whether buyers trust what they see, and whether that visibility turns into revenue. In 2026 they have to measure both the links people click and the AI answers they read without clicking.
Search now has two scoreboards: the links people click, and the AI answers they read without clicking. A report that counts only rankings and sessions will understate your brand’s influence and overstate your losses at the same time.
This playbook gives leadership one way to judge whether search is working in 2026 and beyond:
-
- Four layers, one direction.Every KPI sits in one of four layers: Presence, Authority, Engagement and Revenue. Presence is the earliest signal; Revenue is the verdict.
- Twelve core KPIs, not fifty.Three per layer. Everything else is a diagnostic your team uses, not a number the board needs.
- Read it top-down.Start every review with revenue and pipeline, then move down the layers to explain why it moved.
- Plan conservatively.On informational topics, expect sessions to stay flat or fall while qualified enquiries hold or grow. That is not failure; it is the new shape of search.
At a glance: the 12 SEO and AI search KPIs
- Priority-query visibility: % of your money keywords ranking on page one
- AI answer inclusion rate: % of buyer prompts where AI tools name your brand
- Impressions on money topics: your search footprint, even when clicks fall
- AI share of voice: your AI mentions versus named competitors
- Citation share: how often AI answers link to your pages
- Branded search demand: how many people search your name
- Engaged sessions from search: organic and AI visits that show real interest
- Commercial-page reach: % of search visits that reach product, service or pricing pages
- Conversion rate by source: organic versus AI-referred visitors
- Search-sourced revenue or pipeline
- Search-influenced revenue
- Search cost per acquisition
The question for a CMO is no longer “how much traffic did SEO send?” It is “when a buyer asks Google or an AI assistant about our category, are we in the answer, and does that presence turn into revenue?”
Why Traditional SEO KPIs No Longer Work in 2026
More than two in three Google searches now end without a click, so traffic has stopped being a reliable proxy for search success. Five data points explain why the scoreboard had to change:
| Shift | What the data shows | Source |
|---|---|---|
| Zero-click is now the majority | 68.01% of US Google searches ended without a click in Jan–Apr 2026, up from 60.45% in 2024 | SparkToro / Similarweb |
| Being cited matters more than ranking alone | On AI Overview queries, cited pages earned about 2.1% CTR versus 0.9% for uncited pages; queries with no AI Overview earned about 3.3% | Seer Interactive via Search Engine Land |
| Intent decides exposure | AI Overviews appear on roughly 95% of comparison queries and 86% of question queries, but only about 5% of transactional ones | Seer Interactive via Search Engine Land |
| AI referrals are growing fast from a small base | AI-referred sessions to Shopify stores grew 197% year on year in Q2 2026; organic grew 12% and still sent more sessions than all AI platforms combined | Shopify via CMSWire |
| AI visitors arrive closer to buying | AI-referred shoppers who reached a product page converted about 80% better than organic visitors overall | Shopify via CMSWire |
Two honest caveats belong in every board conversation. First, published AI-conversion premiums range widely, from about 1.2x to 9x depending on study and industry; this playbook plans on the conservative end. Second, AI influence is under-counted: Google AI Overview clicks still arrive labelled as organic, and many assistant-driven visits land as direct traffic.
What has not changed: AI answers lean heavily on pages that already rank well. Classic SEO is the foundation that AI visibility is built on, not a channel it replaces, which is why strong SEO services still come first.
The Search Value Pyramid: 4 Layers of SEO and AI Search KPIs
Every KPI in this playbook sits in one of four layers, and each layer answers a different question leadership is really asking.
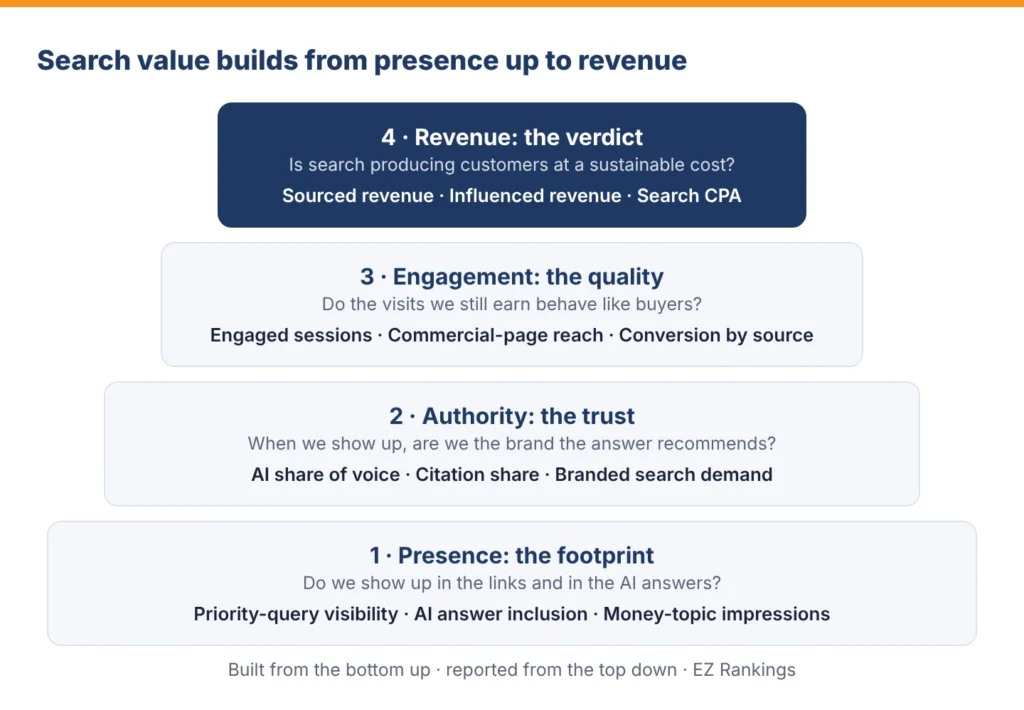
Presence moves first and Revenue moves last. Leadership reads the pyramid from the top; the team works on it from the bottom. A drop at the top is diagnosed by walking down until you find the layer that moved first.
Layer 1: Presence
Presence answers one question: when buyers search our category, do we show up at all, in the links and in the answers? It is the earliest signal and moves first, so it is where a new programme proves it is working.
| KPI | What it tells leadership | How it is measured | Healthy direction |
|---|---|---|---|
| 1. Priority-query visibility | Share of the searches that matter commercially where we appear on page one | A fixed set of 50–200 money queries, tracked weekly in a rank tracker; % ranking in the top 10 | Rising quarter on quarter |
| 2. AI answer inclusion rate | How often AI assistants mention us when buyers ask category questions | A fixed set of buyer prompts run monthly across ChatGPT, Gemini, Perplexity, Google AI Overviews and AI Mode; % of answers that name the brand | Rising, and ahead of the closest competitor |
| 3. Impressions on money topics | Whether our total search footprint is growing even when clicks are not | Google Search Console impressions filtered to priority pages and topics, including its AI-feature reporting where available | Rising faster than clicks is normal in 2026 |
Diagnostics the team tracks (not board KPIs): indexed pages, Core Web Vitals pass rate, crawl errors, structured-data validity, featured-snippet and local-pack ownership.
For local businesses: add Google Business Profile views, calls, website clicks and direction requests to Presence. For clinics, stores and service-area businesses, these often matter more than national rankings, and they’re the focus of our local SEO services.
Read with care: rising impressions with falling CTR is usually AI Overviews absorbing informational clicks, not a ranking problem. Check whether the affected queries are informational before reacting.
Layer 2: Authority
Authority answers: when we show up, are we the brand the answer trusts and recommends? Presence gets you named; authority gets you chosen. This is the layer most reports miss and the one premium brands win or lose on. Authority is where Google’s E-E-A-T signals and AI trust overlap; we explain how in our guide to E-E-A-T in the AI era.
| KPI | What it tells leadership | How it is measured | Healthy direction |
|---|---|---|---|
| 4. AI share of voice | Our share of brand mentions in AI answers against named competitors | Same monthly prompt set; our mentions ÷ total mentions of us plus our top 3–5 competitors | Rising; leading in our core category prompts |
| 5. Citation share | How often AI answers link to our own pages as a source | Same prompt set; our domain’s citations ÷ all citations returned | Rising; concentrated on pages we control |
| 6. Branded search demand | Whether visibility that earns no click still builds the brand | Branded query impressions and clicks in Search Console, plus Google Trends for the brand name, compared year on year | Growing faster than the category |
Diagnostics the team tracks: answer accuracy (does the AI describe our products, prices and claims correctly?), sentiment of AI mentions, referring domains from relevant publications, reviews volume and rating, and mentions on the forums and platforms AI tools cite most in our category.
Why branded demand is a board KPI: it is the cleanest proof that zero-click exposure works. If buyers read about you in an AI answer and later search your name, that demand shows up here even when the original answer never sent a click.
Accuracy is a risk metric, not a vanity one. An AI that misstates your pricing, ingredients or credentials is a reputation problem. Any factual error found in the monthly prompt run should be logged and fixed at source: on your site, your structured data and the third-party pages the AI is citing.
Layer 3: Engagement
Engagement answers: do the visits we still earn behave like buyers? With fewer clicks, each visit carries more weight, so quality per visit replaces volume as the thing to manage.
| KPI | What it tells leadership | How it is measured | Healthy direction |
|---|---|---|---|
| 7. Engaged sessions from search | Visits that show real interest, from organic and AI sources combined | GA4 engaged sessions for the Organic Search channel plus a custom “AI Referrals” channel (chatgpt.com, perplexity.ai, gemini.google.com, copilot.microsoft.com and similar) | Stable or rising even if total sessions fall |
| 8. Commercial-page reach | Whether search visitors reach the pages where money is made | % of search sessions that view a product, service, pricing or booking page | Rising |
| 9. Conversion rate by source | Whether AI and organic visitors convert, side by side | Key events (enquiry, add to cart, booking, purchase) ÷ sessions, split by Organic vs AI Referrals | AI at or above organic; both stable or rising |
Diagnostics the team tracks: landing-page engagement by template, scroll depth on long-form content, internal search usage, form abandonment, and the share of AI visitors landing directly on product or service pages.
Set up the AI channel first: Without it, AI visitors are split across Referral and Direct, and the most valuable traffic you earn becomes invisible. The step-by-step setup is in the GA4 section below.
Layer 4: Revenue
Revenue is the verdict: is search producing customers at a cost the business can sustain? Every review starts here, and every layer below exists to explain the number on this line.
| KPI | What it tells leadership | How it is measured | Healthy direction |
|---|---|---|---|
| 10. Search-sourced revenue or pipeline | Money directly attributed to organic and AI search | E-commerce: GA4 purchases revenue by channel. Lead-gen: CRM opportunities and closed revenue where first or last touch is Organic or AI Referrals | Rising year on year |
| 11. Search-influenced revenue | Money where search played a part anywhere in the journey | CRM or GA4 data-driven attribution: deals with any organic or AI touch, plus “how did you hear about us?” answers that name Google, ChatGPT or another AI tool | Rising; typically larger than sourced revenue |
| 12. Search cost per acquisition | Whether search is an efficient way to win customers | Total search investment (fees, content, tools, PR) ÷ new customers sourced by search, compared with paid-channel CAC | Falling over time, below paid CAC by month 9–12 |
Add one question to every enquiry form and checkout: “Where did you first hear about us?” with AI assistant as an option. Self-reported attribution is imperfect, but it is the only way to see AI influence that analytics cannot.
Report sourced and influenced separately, never summed. Sourced revenue is the conservative floor. Influenced revenue shows reach. Adding them double-counts and erodes trust in the whole report.
SEO and AI Search KPIs Across the Customer Journey
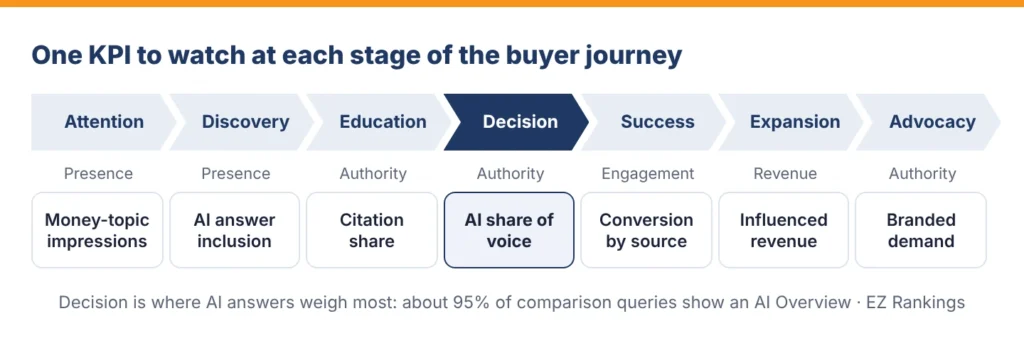
The twelve KPIs map onto the seven-stage journey EZ Rankings uses for every engagement, so each stage has one number that tells you whether search is doing its job there.
| Stage | Layer | Lead KPI | What it tells you |
|---|---|---|---|
| Attention | Presence | Money-topic impressions | Buyers are seeing you in search |
| Discovery | Presence | AI answer inclusion | AI tools name you when buyers explore the category |
| Education | Authority | Citation share | AI answers use your pages as a source |
| Decision | Authority | AI share of voice | You’re recommended over competitors when buyers compare |
| Success | Engagement | Conversion by source | Search visitors become customers |
| Expansion | Revenue | Influenced revenue | Search keeps contributing to repeat and upsell revenue |
| Advocacy | Authority | Branded demand | More people search for you by name |
The Decision stage deserves the closest watch. Comparison queries, the “X vs Y” and “best for” searches buyers run just before choosing, are the ones AI answers almost always intercept. If a competitor owns AI share of voice here, strong rankings elsewhere will not make up for it.
SEO Vanity Metrics to Stop Reporting (and What to Track Instead)
Stop putting these numbers in front of leadership on their own; each one has a replacement that answers the real question.
| Stop reporting | Why it misleads in 2026 | Report this instead |
|---|---|---|
| Total organic sessions | Falls on informational topics even when the business is winning | Engaged sessions from search + commercial-page reach |
| “Keywords ranking” counts | Thousands of irrelevant long-tail terms inflate the number | Priority-query visibility on a fixed money set |
| Average position | Blends brand and non-brand, high and low value queries | Visibility on priority queries, split brand vs non-brand |
| Domain Authority / Domain Rating | A third-party score, not a Google or AI metric | Citation share and referring domains from relevant publications |
| Backlinks built | Volume says nothing about relevance or influence | Mentions on sources AI tools actually cite in your category |
| Pages published | Activity, not outcome | Share of new pages earning impressions or AI citations within 90 days |
| “Ranked #1 in ChatGPT” screenshots | One prompt, one run, one day; AI answers vary run to run | AI answer inclusion rate across a fixed prompt set, run monthly |
The test for any metric: if it went up 20% next month, would revenue be more likely to rise? If the honest answer is “not necessarily”, it is a diagnostic, not a KPI.
How Often to Report SEO and AI Search KPIs: The Presence & Performance Ledger
Each layer moves at a different speed, so each gets its own rhythm. The monthly Presence & Performance Ledger is the one page leadership reads; everything else feeds it.
| Cadence | Audience | What is reviewed | Format |
|---|---|---|---|
| Weekly | Marketing team | Priority-query visibility, technical alerts, AI referral sessions, anything that moved more than 15% | 15-minute stand-up, dashboard only |
| Monthly | CMO / founder | The Ledger: all 12 KPIs, top-down from Revenue to Presence, with a one-line “why it moved” per layer | One page + 30-minute review |
| Quarterly | Leadership / board | Revenue and CAC trend, AI share of voice vs competitors, branded demand, next-quarter priorities | 5-slide summary |
| Twice a year | Leadership | Refresh the priority query set and the AI prompt set; re-benchmark competitors | Workshop |
How the Ledger reads, top to bottom:
- Revenue line— sourced revenue, influenced revenue, search CAC, each with month-on-month and year-on-year change.
- Engagement line— engaged sessions, commercial-page reach, conversion rate by source.
- Authority line— AI share of voice, citation share, branded demand.
- Presence line— priority-query visibility, AI answer inclusion, money-topic impressions.
- Decisions— three actions for next month, each tied to the KPI it is meant to move.
Want results like this for your business?
Talk to our SEO & AI visibility experts — no forms, no waiting.
Get a Free ProposalEvery number carries a status (on track / watch / act) and a one-sentence reason. A number without a reason is noise.
A US immigration law firm targeting investors in the UAE ranked #1 on Google UAE for “best EB-5 lawyers”, yet the AI Overview for that search cited attorney directories and a competitor’s list instead. Here is how its first eight weeks read in the Ledger:
| Layer | KPI | Baseline | After 8 weeks | Status |
|---|---|---|---|---|
| Revenue | UAE consultation enquiries | — | +30% in 1.5 months | On track |
| Authority | Mentioned in ChatGPT and Perplexity answers | No | Yes, for the tracked queries | On track |
| Authority | Cited in the AI Overview for ‘best EB-5 lawyers’ | No | Yes | On track |
| Presence | AI answer inclusion (10 tracked EB-5 queries) | 0 of 10 | 6 of 10 | On track |
| Presence | Priority-query visibility (‘best EB-5 lawyers’) | #1 | #1 (held) | On track |
What moved it: a direct answer at the top of the page, an FAQ with FAQPage and LegalService schema, stronger attorney credentials and bar admissions, UAE-specific content, and listings on the legal directories and Gulf business media that AI answers were citing.
SEO and AI Search Benchmarks and Realistic Timelines
Plan on the cautious end of published research, and judge progress against your own baseline rather than an industry average. These are EZ Rankings’ planning assumptions, drawn from the studies cited above; your category may sit above or below them.
| Planning assumption | Conservative figure to use | Why this figure |
|---|---|---|
| Click loss on informational queries with AI Overviews | Plan for CTR roughly halving | Cited pages earn ~2.1% vs ~3.3% with no AI Overview; uncited pages ~0.9% |
| AI referral share of total traffic | Around 1% today, growing | Large cross-industry panels place AI referrals near 1% of sessions in 2026 |
| AI vs organic conversion rate | Model AI at 1.5–2x organic, not 4–9x | Published premiums range from ~1.2x to 9x; Shopify saw ~1.8x on product pages |
| Transactional query exposure | Lowest AI Overview risk | Only ~5% of transactional queries show an AI Overview |
Realistic timelines from a clean baseline:
| Layer | First signal | Meaningful movement |
|---|---|---|
| Presence | 6–10 weeks | 3–6 months |
| Authority | 2–3 months | 6–9 months |
| Engagement | 1–2 months after Presence moves | 4–6 months |
| Revenue | 4–6 months | 9–12 months |
If someone promises page-one rankings or AI citations in 30 days, ask what happens in month four. Search compounds; it rarely spikes and holds.
90-Day Roadmap to Set Up SEO and AI Search KPI Tracking
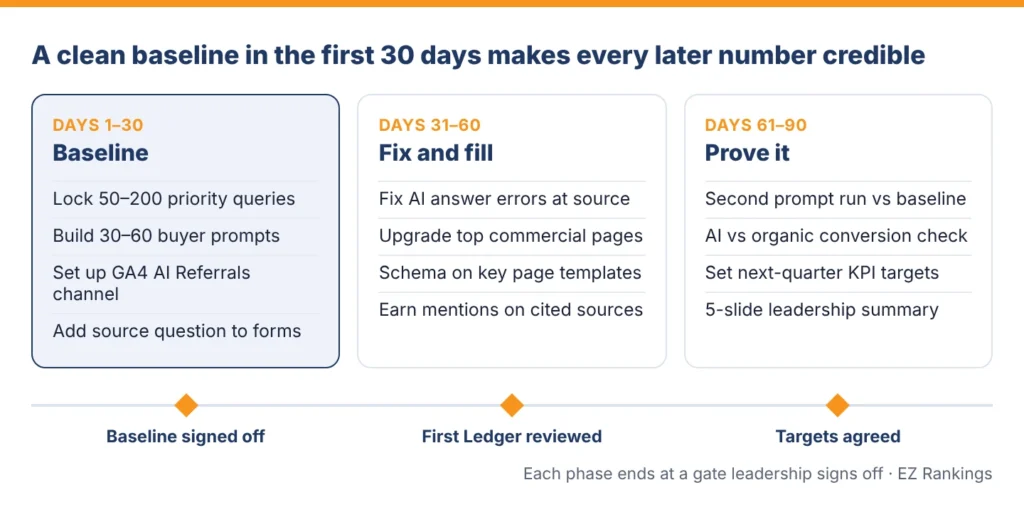
Ninety days is enough to install the system and see first movement in Presence; it is not enough to judge Revenue. Each phase ends at a gate that leadership signs off.
| Phase | What to do | Gate (leadership signs off) |
|---|---|---|
| Days 1–30: Baseline | Lock 50–200 priority queries · Build 30–60 buyer prompts · Set up the GA4 AI Referrals channel · Add a ‘where did you hear about us?’ question to forms | Baseline signed off |
| Days 31–60: Fix and fill | Fix AI answer errors at source · Upgrade top commercial pages · Add schema to key page templates · Earn mentions on the sources AI tools cite | First Ledger reviewed |
| Days 61–90: Prove it | Second prompt run versus baseline · AI versus organic conversion check · Set next-quarter KPI targets · 5-slide leadership summary | Targets agreed |
Do not skip the baseline. Without a locked query set, a locked prompt set and a working AI channel in GA4, every later improvement is an anecdote rather than evidence.
Tools and Formulas for Tracking SEO and AI Search KPIs
Five tools cover all twelve KPIs; most brands already own three of them.
| Need | Tool | KPIs it feeds |
|---|---|---|
| Search impressions, clicks, AI-feature performance | Google Search Console (free) | 3, 6 |
| Sessions, engagement, conversions, AI Referrals channel | Google Analytics 4 (free) | 7, 8, 9, 10 |
| Priority-query rankings and competitor visibility | Arank tracker such as Semrush or Ahrefs | 1 |
| AI answer inclusion, share of voice, citations | An AI visibility tracker, or a disciplined manual prompt log in a spreadsheet | 2, 4, 5 |
| Pipeline, revenue, attribution, “how did you hear about us?” | Your CRM or e-commerce platform | 10, 11, 12 |
For channel-wide metrics beyond search, see our guide to digital marketing KPIs for the AI era.
| KPI | Formula |
|---|---|
| AI answer inclusion rate | (AI answers that mention the brand ÷ total AI answers in the prompt set) × 100 |
| AI share of voice | (Brand mentions ÷ (brand mentions + competitor mentions)) × 100 |
| Citation share | (Citations to our domain ÷ all citations returned) × 100 |
| Commercial-page reach | (Search sessions viewing a product, service or pricing page ÷ all search sessions) × 100 |
| Search cost per acquisition | (Fees + content + tools + PR) ÷ new customers sourced by organic and AI search |
Example: you run 40 buyer prompts three times each across ChatGPT, Gemini and Perplexity (360 answers). Your brand appears in 90 of them. AI answer inclusion rate = 90 ÷ 360 × 100 = 25%. If your three competitors appear 150 times in total, AI share of voice = 90 ÷ (90 + 150) × 100 = 37.5%.
Prompt-set discipline: run each prompt at least three times per platform per month and record the majority result. AI answers vary between runs, and a single run will mislead you in both directions.
How to Track AI Referral Traffic in GA4
By default, GA4 files visits from ChatGPT, Perplexity and other AI assistants under Referral or Direct. A custom channel gives them their own line in every report.
- In GA4, go to Admin, then Data display (or Data settings in older accounts), then Channel groups.
- Click Create new channel group and name it, for example, ‘Channels with AI’.
- Click Add new channel, name it ‘AI Referrals’, and set the condition: Source matches regex, using the pattern below.
- Drag ‘AI Referrals’ above ‘Referral’ in the channel list, so AI visits are matched first.
- Save, then use this channel group in your acquisition and conversion reports.
chatgpt\.com|chat\.openai\.com|perplexity\.ai|gemini\.google\.com|copilot\.microsoft\.com|claude\.ai|meta\.aiTwo limits to keep in mind: clicks from Google AI Overviews and AI Mode still arrive as organic search, and many assistant visits arrive with no referrer at all and land as Direct. Treat this channel as a floor, not a full count.
How to Build Your AI Prompt Set
Your prompt set is the fixed list of questions you run every month to measure AI answer inclusion, share of voice and citation share. Build it once, keep it stable and refresh it twice a year.
- Start with 30–60 prompts. Mix four types: category prompts (‘best [service] in [city]’), problem prompts (‘how do I [solve problem]’), comparison prompts (‘[you] vs [competitor]’) and brand prompts (‘what is [brand]’).
- Write them the way buyers talk. Take wording from sales calls, enquiry forms and Search Console queries.
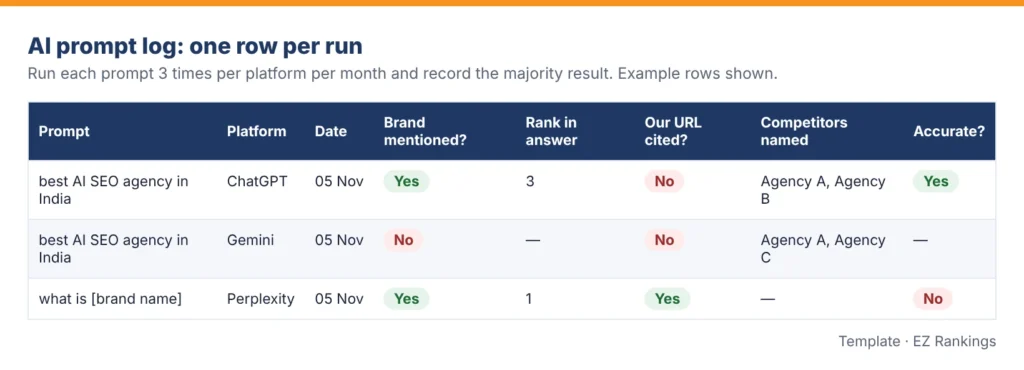
- Run each prompt three times per platform per month: ChatGPT, Gemini, Perplexity, Google AI Overviews and AI Mode. Record the majority result.
- Log every run in one sheet with the same columns (below).
- Lock the set. Change prompts only at the twice-yearly review, so month-on-month numbers stay comparable.
| Prompt | Platform | Date | Brand mentioned? | Rank in answer | Our URL cited? | Competitors named | Accurate? |
|---|---|---|---|---|---|---|---|
| best AI SEO agency in India | ChatGPT | [date] | Yes / No | [1–10] | Yes / No | [names] | Yes / No |
 Tracking which sources AI answers cite also shows you where to earn mentions, which is the core of answer engine optimization (AEO).
FAQs
What are SEO KPIs?
SEO KPIs are the metrics that show whether search is helping your business grow. In 2026 they cover four areas: presence in search results and AI answers, authority and trust, the quality of the visits you earn, and the revenue search produces.
What are the most important SEO KPIs in 2026?
Start with search-sourced revenue or pipeline, AI answer inclusion rate, AI share of voice, branded search demand and conversion rate by source. Together they show whether you’re visible, trusted and turning that visibility into customers.
How do you measure AI search visibility?
Run a fixed set of 30–60 buyer prompts every month across ChatGPT, Gemini, Perplexity and Google AI Overviews. Record how often your brand is mentioned (inclusion rate), how often versus competitors (share of voice) and how often your pages are cited (citation share).
Can you track ChatGPT traffic in Google Analytics 4?
Yes. Create a custom channel group in GA4 with an ‘AI Referrals’ channel that matches AI domains such as chatgpt.com and perplexity.ai, and place it above Referral. Some AI visits still arrive as Direct, so treat the number as a minimum.
What is the difference between AI mention rate and AI share of voice?
Mention rate (inclusion rate) shows how often AI answers name your brand at all. Share of voice compares your mentions with your competitors’ in the same answers. You can have a high mention rate and still lose share of voice if competitors appear more often.
Should you still track keyword rankings?
Yes, but only for a fixed set of 50–200 money keywords, not total keywords ranked. AI answers lean heavily on pages that already rank well, so rankings on priority queries remain a leading indicator.
Why is organic traffic falling when rankings are stable?
Usually because AI Overviews now answer many informational queries on the results page. Impressions rise while clicks fall. Check whether the affected queries are informational before treating it as a ranking problem.
How long does it take to see results from SEO and AI search work?
Presence KPIs usually show a first signal within 6–10 weeks, authority within 2–3 months, and revenue within 4–6 months, with meaningful movement in revenue at 9–12 months. Judge progress against your own baseline, not industry averages.
A closing note
The brands that win search over the next three years will not be the ones with the most traffic. They will be the ones buyers meet in the answer, trust enough to search for by name, and choose when it matters. Measure that, honestly and consistently, and the strategy tends to follow.
EZ Rankings sets up this measurement system as part of its AI SEO services, runs the monthly Presence & Performance Ledger, and reviews it with leadership every month. Want to know where your brand stands today? Get a free AI visibility audit and we’ll benchmark your 12 KPIs against your closest competitors.
Sources
- In 2026, Less than One Third of Google Searches Still Send a Click — SparkToro with Similarweb data, June 2026
- Google AI Overviews CTR shows early signs of recovery: Study — Search Engine Land on Seer Interactive’s study of 53 brands, Jan 2025–Feb 2026
- Does AI Search Really Beat Organic? Not Yet, Shopify Says — CMSWire on Shopify Q2 2026 data, August 2026
- The State of GEO in Q1 2026 — Superlines summary of Conductor’s 2026 benchmarks (AI referrals at 1.08% of web traffic across 13,770 domains), March 2026
All figures are third-party research and vary by industry, market and method. Treat them as planning context and judge your own results against your own baseline.

Mansi Rana
TEDx speaker and digital marketing expert with 22 years of experience driving business growth through innovation and strategy. Known for leadership rooted in both IQ and EQ, with a focus on ethical marketing and collaboration.
LinkedIn